Bank Of India BALANCED ADVANTAGE FUND
-
Fund Type : An Open Ended Dynamic Asset Allocation FundEntry Load : NilDate of Allotment : March 14, 2014
-
Benchmark :Nifty 50 Hybrid Composite Debt 50: 50 Index Total Return Index (TRI)Exit Load :
Investment Objective
The Bank of India Balanced Advantage Fund aims at providing long term capital appreciation / income from a dynamic mix of equity and debt investments. There is no assurance that the investment objectives of the Scheme will be realized and the Scheme does not assure or guarantee any returns.
Fund Manager
-
Alok Singh
CFA and PGDBA from ICFAI Business School.
 See detail
Fund Highlights
Riskometer
Scheme Riskometer:
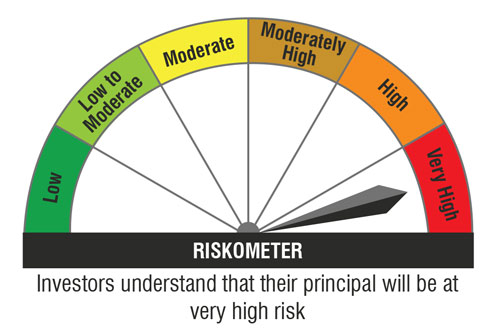
The above Riskometer is based on the portfolio as on 30th April, 2026.
This product is suitable for investors who are seeking*:
- Long term capital appreciation
- Dynamic asset allocation between equity and fixed income based on equity market valuations
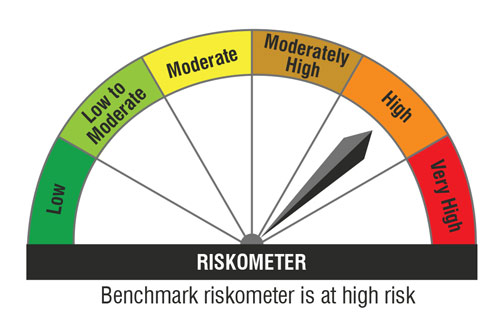
Benchmark Riskometer : NIFTY 50 Hybrid Composite Debt 50:50 Index (TRI) :
*Investor should consult their financial advisor if in doubt about whether the product is suitable for them
Benchmark Riskometer Nifty 50 Hybrid Composite Debt 50:50 Index TRI as on October 31, 2021.
The above Benchmark Riskometer is based on the portfolio as on 30th April, 2026.
Top 10 Portfolio Holdings
Credit Profile
Asset Allocation
Performance(Regular Plan - Growth Option & Direct Plan - Growth Option)
| Current Value of Standard Investment of Rs 10000 in the | |||||||
|---|---|---|---|---|---|---|---|
| Date | NAV Per Unit(Rs.) | Scheme Returns(%)^ | Benchmark Returns #(%) | Additional Benchmark Returns # #(%) | Scheme (Rs) | Benchmark #(Rs) | Additional Benchmark # # (Rs) |
| 1 yrs | 23.5234 | 4.42 % | -0.64 % | -3.99 % | 10442 | 9936 | 9601 |
| 3 yrs | 18.3781 | 10.14 % | 8.39 % | 10.02 % | 13365 | 12737 | 13320 |
| 5 yrs | 15.7444 | 9.30 % | 7.99 % | 10.01 % | 15601 | 14691 | 16113 |
| 10 yrs | 12.5505 | 6.94 % | 10.17 % | 12.53 % | 19571 | 26345 | 32594 |
| Since inception | 10.0000 | 7.74 % | 10.27 % | 12.12 % | 24563 | 32512 | 39705 |
IDCW History(Regular Plan- Regular IDCW)
| Record Date | IDCW (`/Unit) |
| 25-June-2018 | 0.02449771 |
| 25-June-2018 | 0.02449722 |
| 29-July-2021 | 0.40000000 |
| 29-July-2021 | 0.40000000 |
| CLICK HERE TO VIEW THE IDCW HISTORY |